
Why emulators matter
Financial institutions need climate information at a scale that can be linked to exposures, but comprehensive Earth system and impact models are expensive and cover only a limited set of scenarios. Statistical emulators are designed to approximate selected outputs of those models more efficiently.
RIME-X, presented in a 2026 preprint included in the source compilation, extends the Rapid Impact Model Emulator from deterministic trajectories to scenario-dependent probability distributions for regional climate indicators. The approach is important for risk professionals because it treats uncertainty as an output rather than hiding it behind one central path.

The climate modelling chain contains several uncertainties
The RIME-X paper separates uncertainty into four useful categories. Scenario uncertainty comes from different future emissions pathways. Global climate response uncertainty reflects uncertainty in how the Earth system responds to emissions. Model uncertainty arises because different Earth system or impact models produce different responses to the same scenario. Natural variability reflects the chaotic variation that can produce different outcomes even under the same forcing.
This taxonomy is directly relevant to model risk. A bank or insurer that receives a regional temperature or precipitation projection should ask which of these uncertainties are represented and which are excluded.
How RIME-X works conceptually
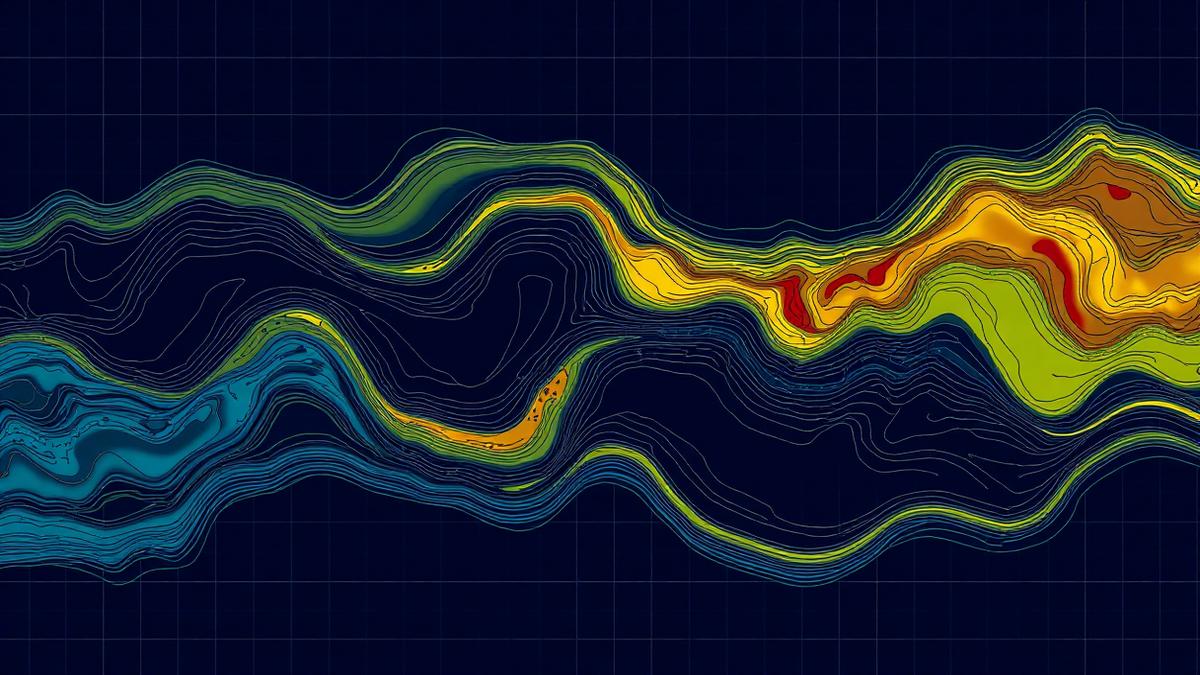
RIME-X combines probabilistic ensembles from simple climate models with weighted data from model intercomparison projects. The simple climate model provides a distribution of global mean temperature for a given emissions scenario and year. The model-intercomparison data provide conditional distributions of regional indicators at different warming levels. These components are combined to produce time-evolving probability distributions for regional climate indicators.
The output is therefore not simply a statement that a region will warm by a specific amount. It is a distribution that reflects several sources of uncertainty and can be generated for different regions, time periods and indicators where the relationship with global warming level is sufficiently informative.
Why distributions are more useful for risk management
Risk management is concerned with the distribution of outcomes, not only the expected value. A regional indicator distribution can support percentile-based stress design, tail analysis, sensitivity testing and the construction of alternative physical risk scenarios. It can also help distinguish between uncertainty in the climate state and uncertainty in the financial translation from climate to loss.
This distinction is critical. RIME-X is not a credit risk model, an insurance pricing model or a capital model. It is a climate emulator. Financial institutions still need a translation layer that maps climate indicators to hazard, exposure, vulnerability, borrower cash flow, collateral, insurance loss or market value.
The model-risk questions remain demanding
Probabilistic output does not eliminate model risk. The RIME-X paper notes limitations associated with model-intercomparison ensembles, weighting choices, the relationship between global warming and regional indicators, and the availability of suitable training simulations. The model is also most applicable where the regional indicator distribution is predominantly determined by warming level.
Validation should therefore examine the choice of training data, weighting methodology, calibration to unseen scenarios, sensitivity to the simple climate model ensemble, regional performance and the stability of tail quantiles. A financial institution should also validate the downstream translation model separately.
A practical architecture for finance
A robust financial implementation can be thought of as four layers. Layer one generates scenario-dependent climate distributions. Layer two converts those distributions into hazard metrics such as flood depth, heat stress or drought severity. Layer three maps hazard to exposure and vulnerability. Layer four translates the result into financial variables such as cash flow, PD, LGD, insurance loss or capital.
The main benefit of probabilistic climate emulation is not that it produces certainty. It does the opposite: it provides a more structured representation of uncertainty that risk models can propagate, challenge and govern.

Conclusion
The key requirement is decision usefulness. Climate analysis adds value when it improves risk identification, pricing, capital allocation, portfolio management or governance, while making uncertainty and model limitations explicit.
Sources
Schwind, N. et al. RIME-X v1.0: Combining Simple Climate Models, Earth System Models, and Climate Impact Models into a Unified Statistical Emulator for Regional Climate Indicators. https://doi.org/10.5194/egusphere-2025-5781

Inter-Sectoral Impact Model Intercomparison Project. https://www.isimip.org
CMIP. https://wcrp-cmip.org
Disclaimer: This article is professional risk-management analysis and is not investment, legal or regulatory advice.