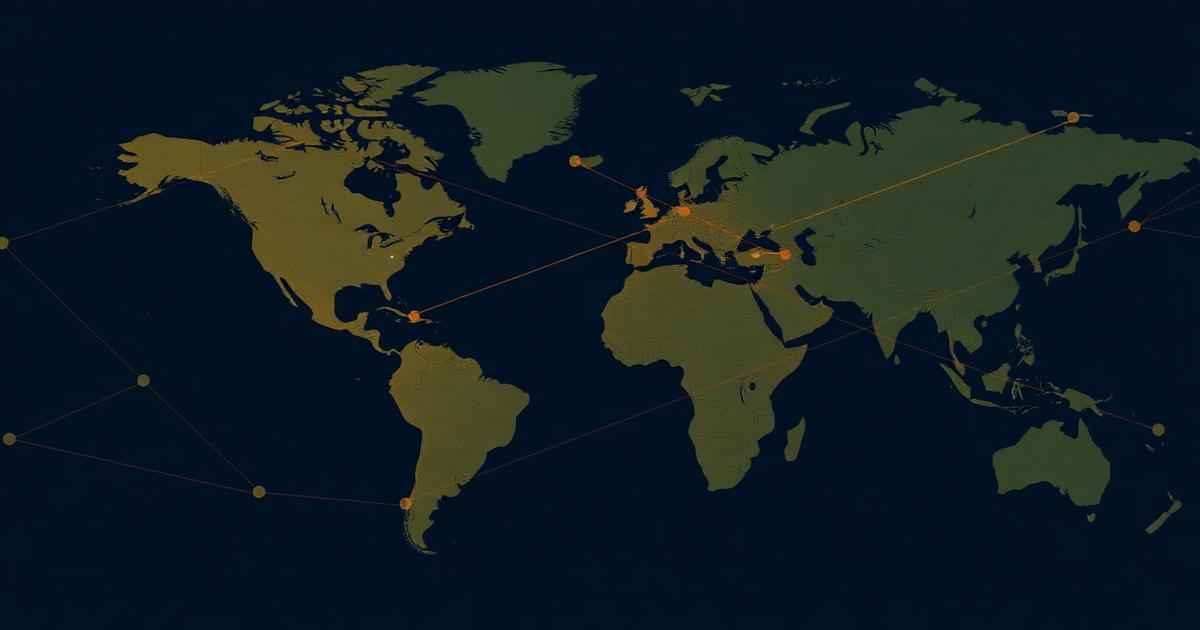
Geopolitical risk sits uncomfortably in most risk frameworks. Credit, market and operational risk have decades of data; geopolitical risk has case studies. The result is that geopolitical risk usually enters the risk report as a paragraph of narrative and a "reputational overlay" of unspecified size. That is not a model — it is an abdication.
This article sets out a defensible quantitative framework for geopolitical and war risk. The framework will not tell you which conflict comes next. It will let you translate a considered view about state transitions and event severities into a probability-weighted loss distribution that can enter capital, reserving and stress-testing processes without pretending to a precision it does not have.
Framing: what geopolitical risk actually is
For risk-modelling purposes, geopolitical risk is the risk that political, security or diplomatic events cause direct or indirect financial loss to a portfolio. "Direct" losses include war damage to insured property, sanctions-driven counterparty default, and expropriation of assets. "Indirect" losses include commodity-price shocks, supply-chain interruption, cross-border capital-flow restrictions and correlated market moves.
The distinction matters because the modelling toolkit differs. Direct losses can be treated with event-based frequency-severity models (see the general treatment in Frequency–Severity Modelling and the climate analogue in Climate/Catastrophe Frequency-Severity). Indirect losses require macro-financial linkage models — closer to cross-asset stress testing.

State-transition models: the backbone
The most useful backbone for a geopolitical model is a discrete-state Markov chain over geopolitical states of the world. A simple example for a country of interest:
- S0 — stable political environment, functioning institutions.
- S1 — heightened tension, sanctions risk, capital-control risk.
- S2 — active low-intensity conflict or major sanctions regime.
- S3 — active high-intensity conflict or comprehensive sanctions.
- S4 — post-conflict / reconstruction, with restrictions removed over time.
Transition probabilities P(S_t+1 | S_t) can be calibrated from expert-elicited priors, historical base rates over comparable jurisdictions, and — importantly — updated as events unfold. The state itself does not directly generate losses; it conditions the loss distribution.
Bayesian updating
Bayesian updating is the mechanism that keeps the model coherent as reality moves. Denote by θ the vector of transition probabilities and by D the observed data (news signals, sanctions actions, troop movements, market signals). Bayes' rule:
P(θ | D) ∝ P(D | θ) · P(θ)
The prior P(θ) encodes the initial view. The likelihood P(D | θ) encodes how each type of observation would look under each state. The posterior P(θ | D) is what the model uses next quarter. A structured evidence log — one row per signal, with source, date and interpretation — is what stops the update from becoming a narrative exercise.
Loss layer: frequency and severity conditional on state
Given a state at time t, the loss distribution is a compound process. Let N_t be the number of loss-inducing events in period t and X_i be the severity of event i:
L_t = Σ_{i=1..N_t} X_i
For direct losses (property, marine hull, cargo, political violence), N_t is well approximated by a Poisson or negative binomial with rate λ(S_t) — higher intensity states produce more events — and X_i by a heavy-tailed distribution, typically a lognormal body with a generalised Pareto tail above a threshold u:
F_X(x) = 1 − (1 − F_body(u)) · (1 + ξ (x − u)/β)^(−1/ξ) for x > u
with ξ, β estimated from historical property, political-violence and terrorism losses. See Climate/Catastrophe Frequency-Severity for the same tail apparatus in a climate context.
For indirect losses, the loss is generated by shocks to market and macro factors — commodity prices, sovereign spreads, currency crosses — with state-conditional shock magnitudes. A defensible approach uses historical case studies (e.g. the 1973 oil shock, the 2014 Russia sanctions episode, the 2022 European energy crisis) to anchor the shock magnitudes in each state.
Scenario design: named scenarios beat unlabelled distributions
A pure Monte Carlo distribution over states and losses is useful for capital numbers but hard for boards to interpret. Named scenarios help. Three complementary designs:
- Base rate scenario: the current best estimate of state transitions, unconditional on any specific event.
- Conditional scenarios: "if country X moves to S2 in Q4, what is the balance-sheet impact?" — conditional expectations from the Monte Carlo run.
- Reverse stress scenarios: what combinations of state transitions across countries make the enterprise non-viable? These are the ones the strategic-planning function needs.
Dependence and cross-country dynamics
Geopolitical events are rarely independent across countries. A conflict in one region moves commodity prices globally; a sanctions episode reshapes trade routes and hits distant economies. The modelling choices are:
- Common factor dependence — a small number of global geopolitical factors (energy security, US–China dynamics, sanctions regime intensity) drives country-level state probabilities.
- Copula dependence — a Gaussian or t-copula across country loss distributions, with correlation estimates from historical episodes.
- Named-scenario aggregation — losses are correlated within a scenario by construction, aggregated with scenario probabilities.
The first two are more general; the third is more transparent for governance. A production framework often runs both.
Implementation pitfalls
Several failure modes are worth naming.
- Sentiment analysis as a substitute for structure. News-sentiment scores fed directly into loss models are attractive because they scale, but they encode the sentiment of the media, not the state of the world. They belong as evidence for the Bayesian update, not as the model's driver.
- Overconfident priors. Assigning three decimals of confidence to a next-year transition probability from S0 to S3 is not rigour; it is theatre. Wide priors and honest confidence intervals are more defensible.
- Fabricated case-study statistics. It is tempting to write "GDP declined X% during scenario Y"; unless the number is genuinely from a cited source, the model becomes worse than a narrative.
- Ignoring endogenous effects. Sanctions responses, retaliation, capital-control announcements — these are as much part of the loss chain as the initiating event. Modelling only the initiating shock understates severity.
Validation and governance
Validation of geopolitical models cannot rely on backtesting alone — the frequency of events is too low. The validator's toolkit is:
- Structural review: does the state definition capture the events the portfolio is exposed to?
- Calibration challenge: are transition probabilities consistent with historical base rates over comparable jurisdictions and time periods?
- Sensitivity: does the loss distribution respond sensibly to changes in transition probabilities and severity parameters?
- Named-scenario benchmarks: do specific well-known past events, if replayed, produce plausible losses?
Governance requires an evidence log that survives the departure of the person who wrote it, and quarterly review by a committee that includes non-modelling participants (strategy, legal, government affairs). See the general framework in The Model Validation Lifecycle.
Limitations
Geopolitical models have wider confidence intervals than any other risk-model family. They are useful for:
- Ordering scenarios by severity.
- Identifying which portfolios have the most exposure to which countries.
- Providing a defensible input to capital and stress-testing frameworks.
They are not useful for:
- Point forecasts of specific conflicts.
- Fine-grained pricing of individual exposures.
- Replacing named-scenario governance with a distributional summary.
A candid caveat in the board pack — describing the model as "structured judgement rather than prediction" — is stronger than a false-precision presentation.
Conclusion
Geopolitical risk resists quantification, but not defensible modelling. A state-transition backbone, Bayesian updating from a structured evidence log, a compound loss layer with heavy tails, and named scenarios for governance together produce numbers that boards can act on and validators can challenge. The alternative — a paragraph and an overlay — leaves the largest tail-risk category outside the model.
Related reading
References and further reading
- International Monetary Fund, Global Financial Stability Report, geopolitical-risk chapters.
- Bank for International Settlements, papers on geopolitical risk and financial stability.
- Caldara, D., and Iacoviello, M., Measuring Geopolitical Risk, American Economic Review (2022).
About the author
Part of an ongoing series on quantitative risk modelling — more about the author.